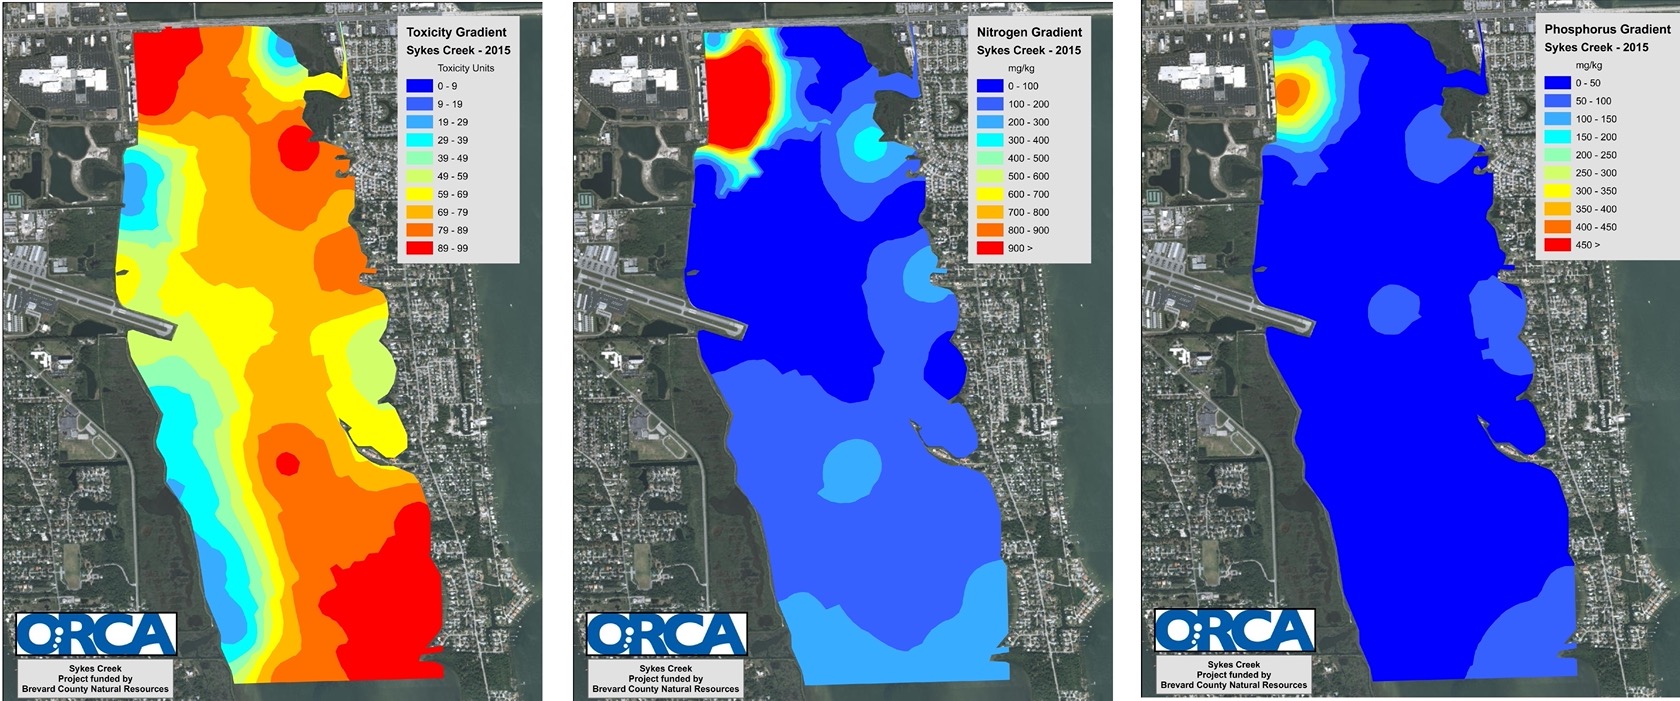
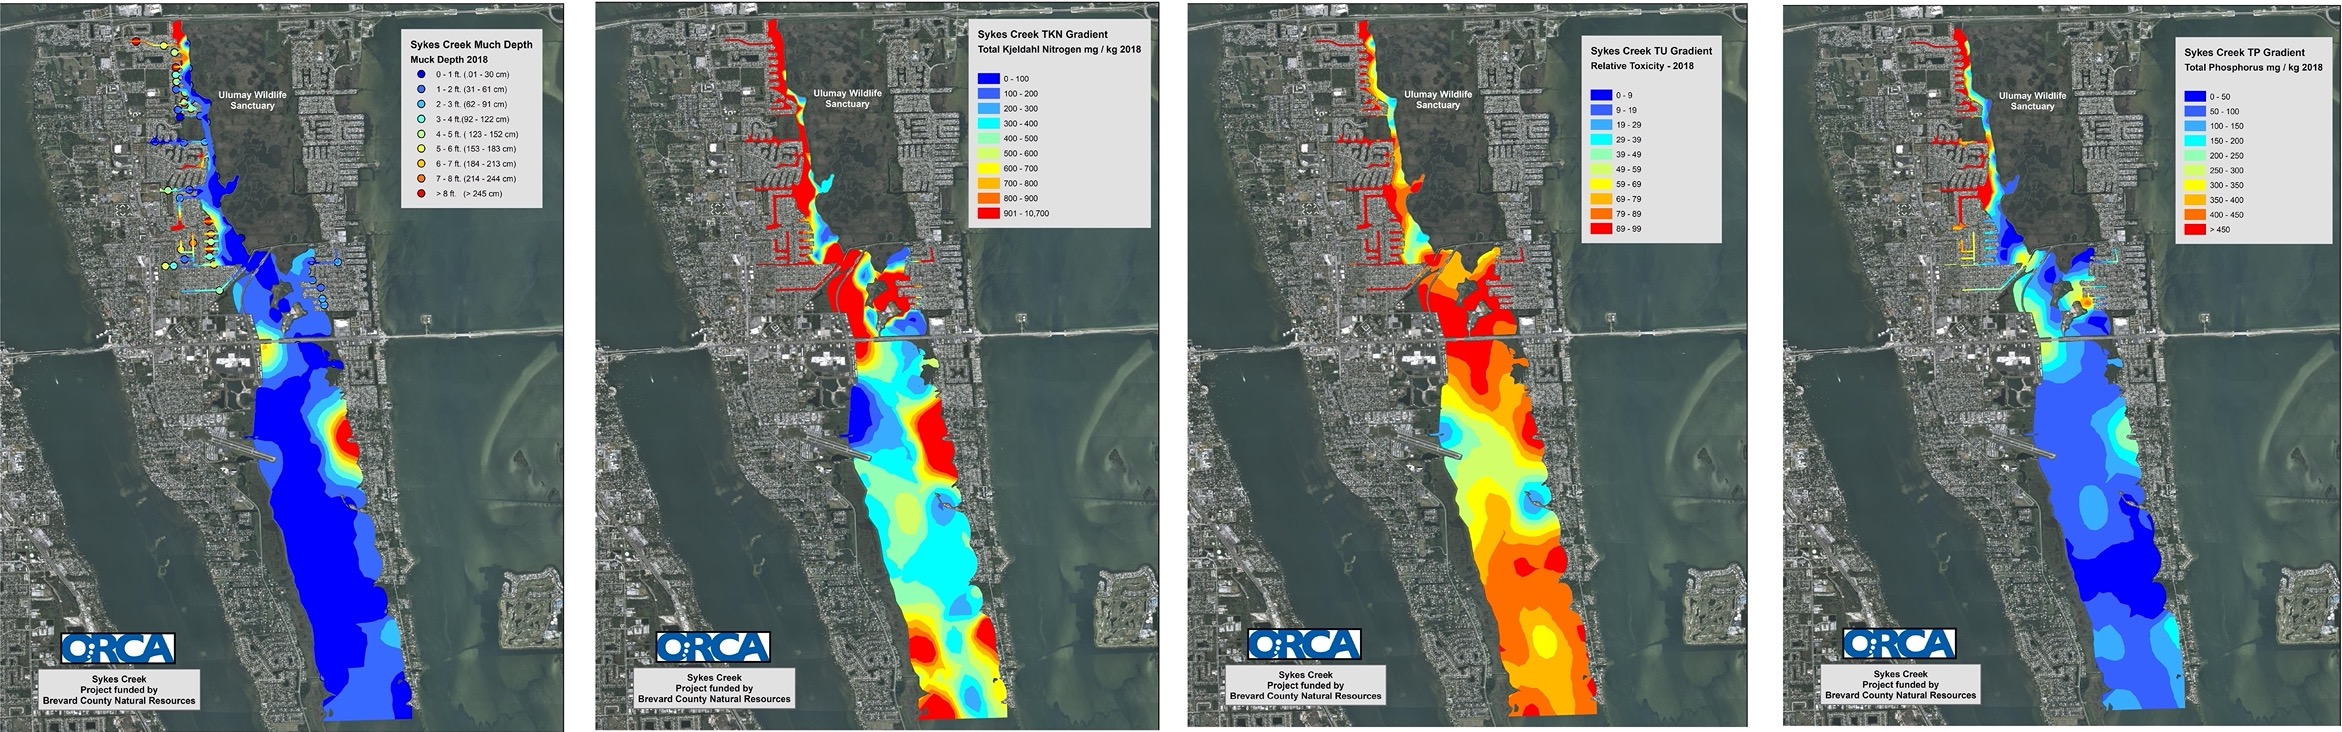
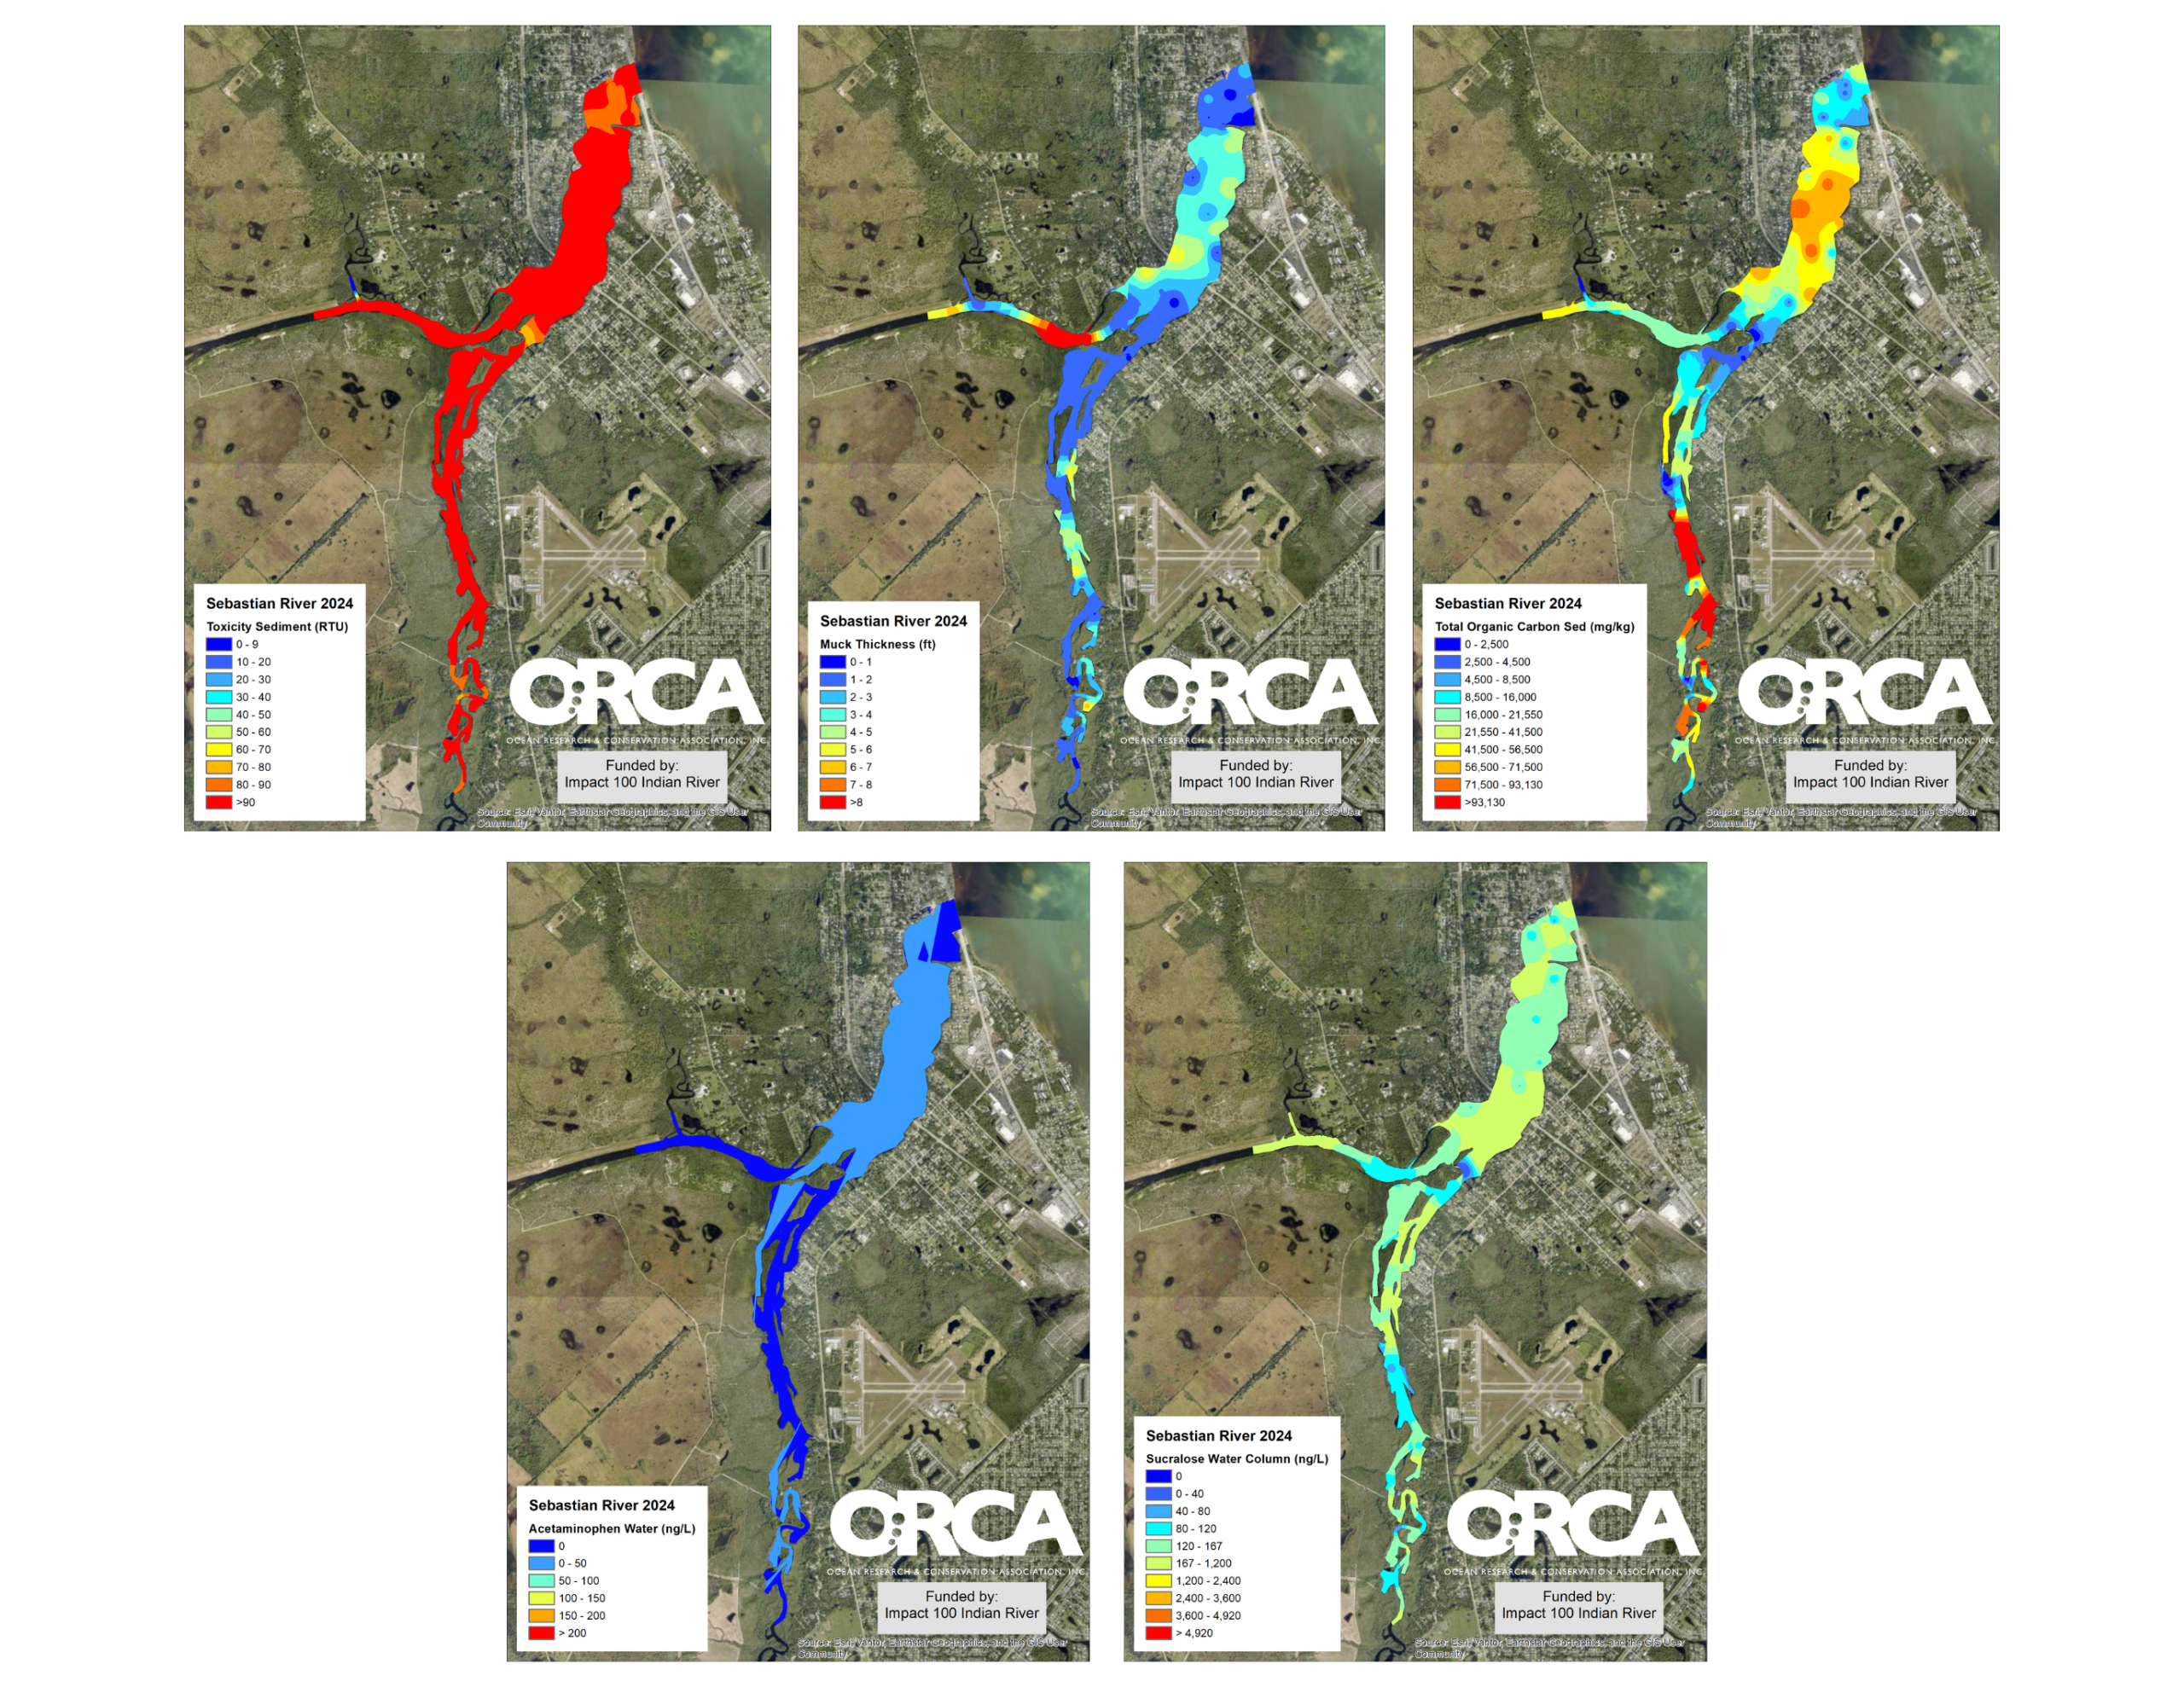
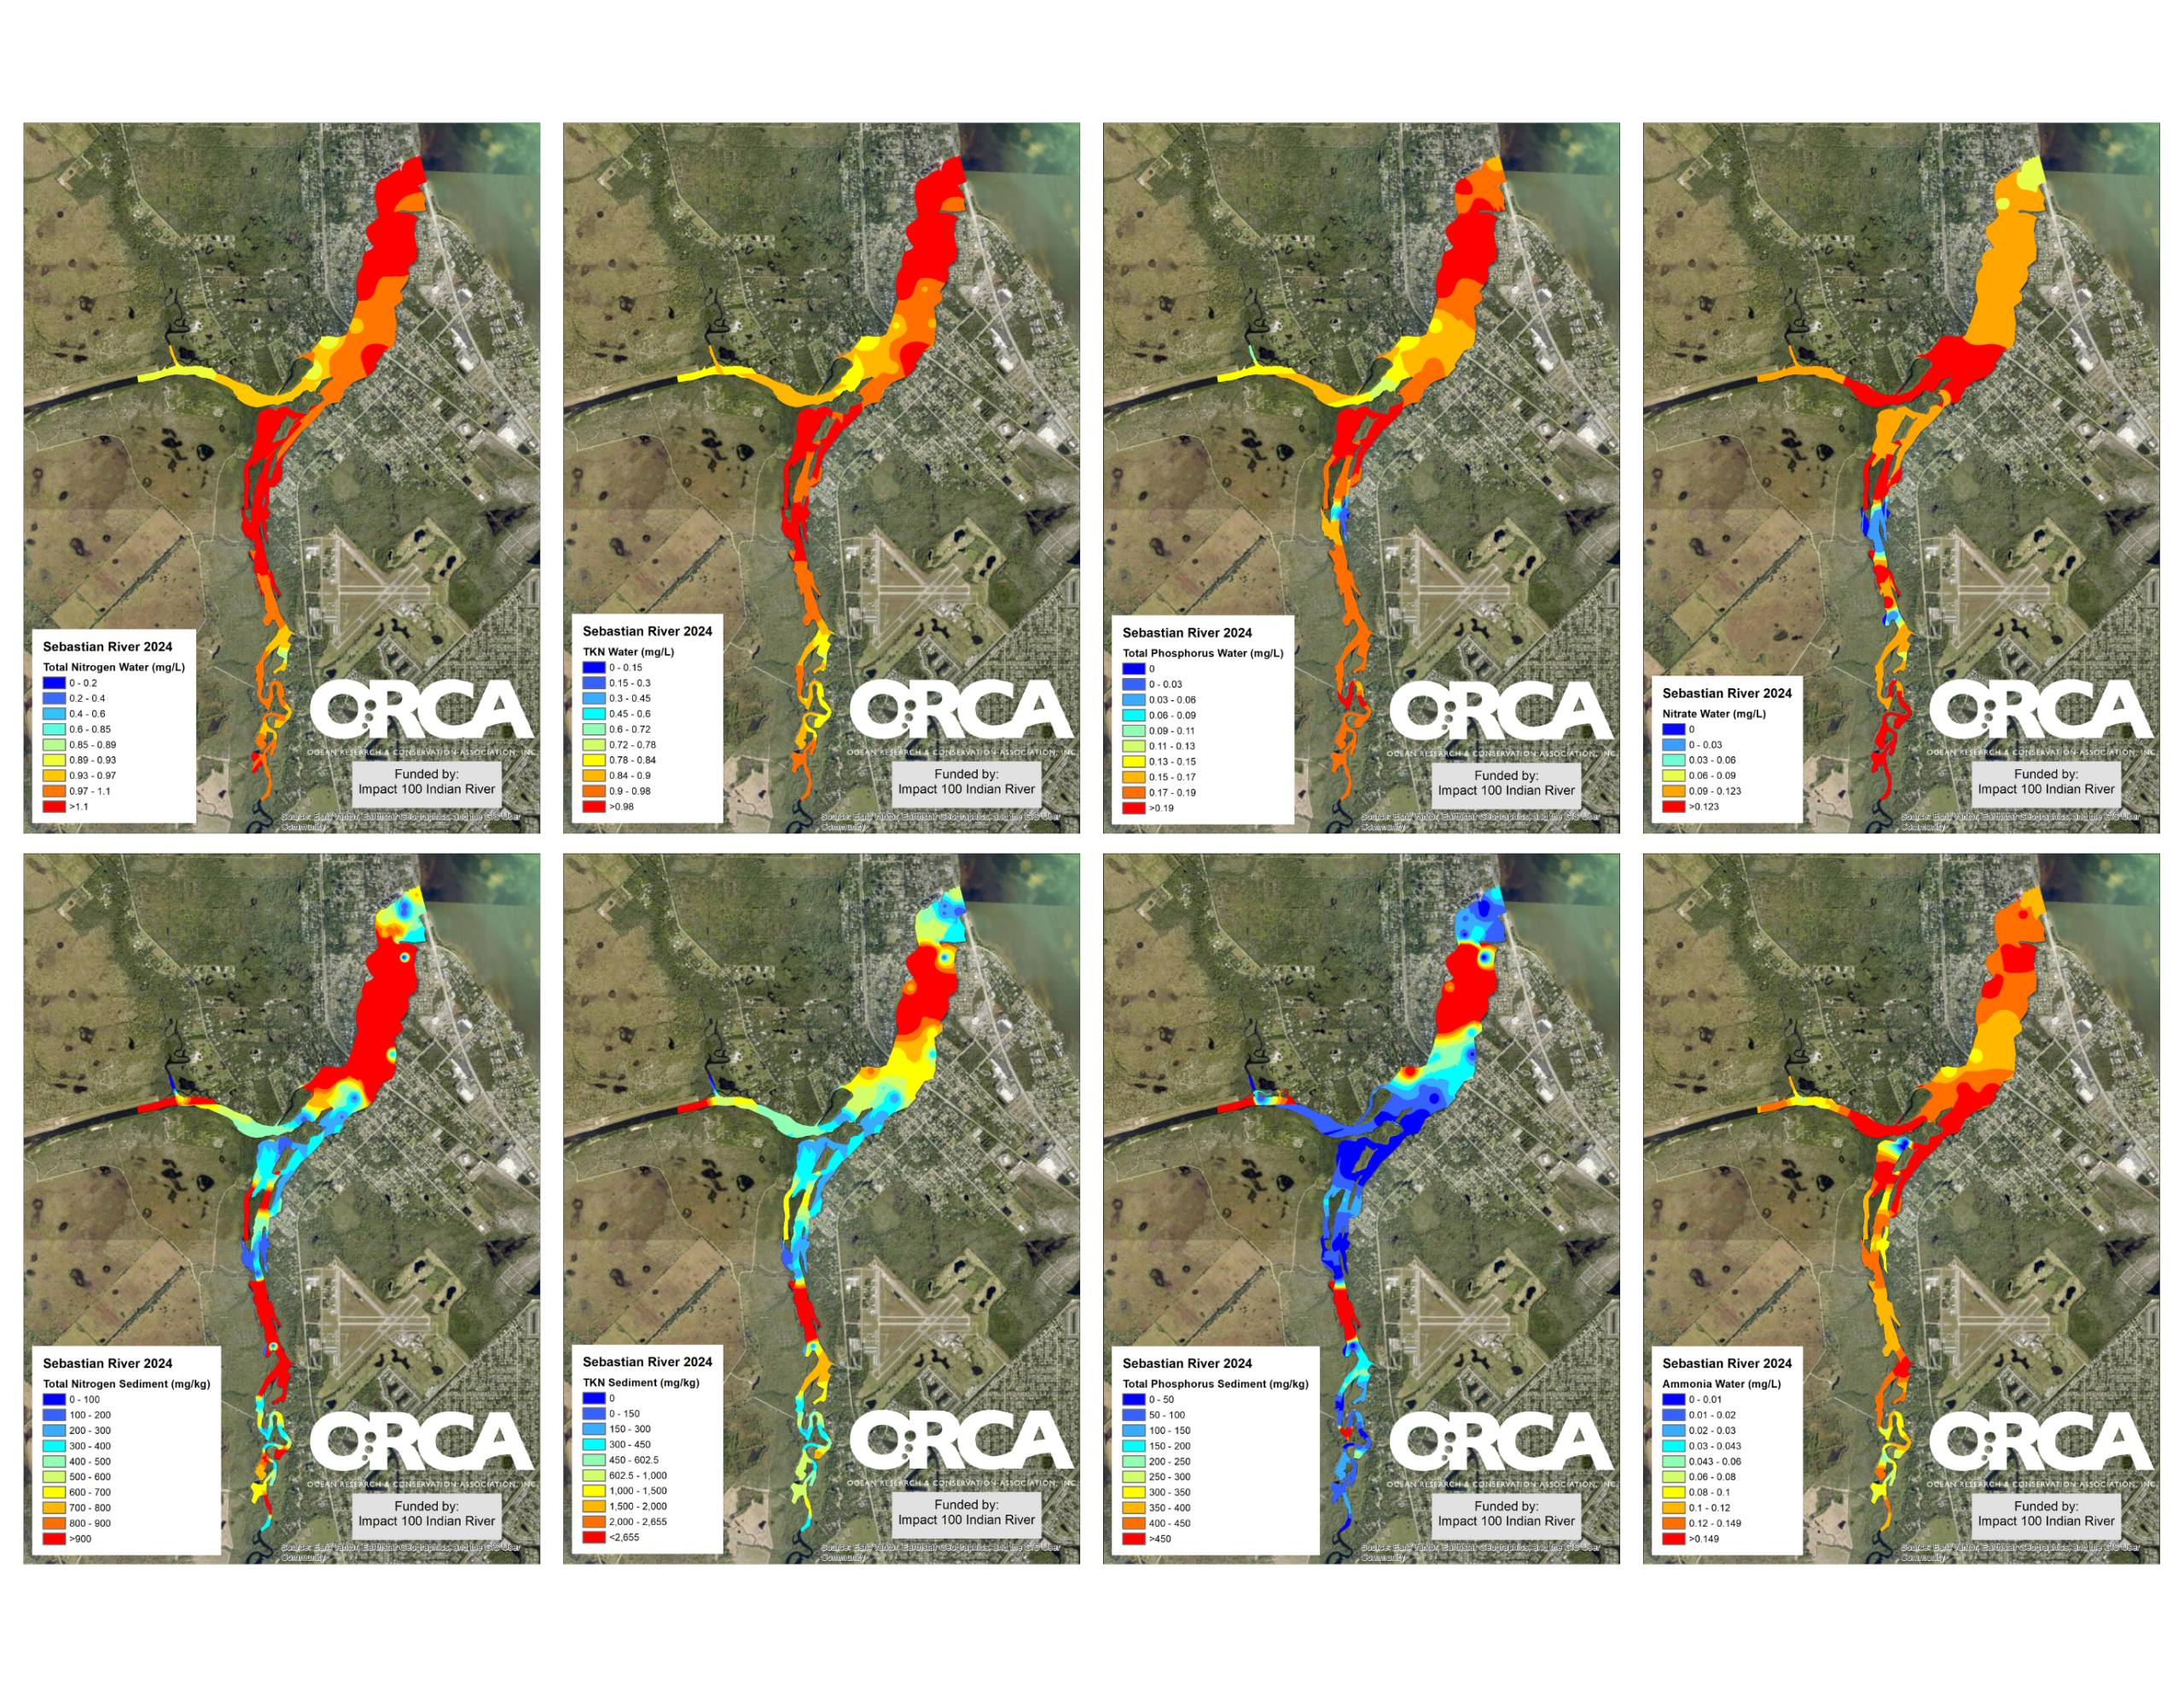
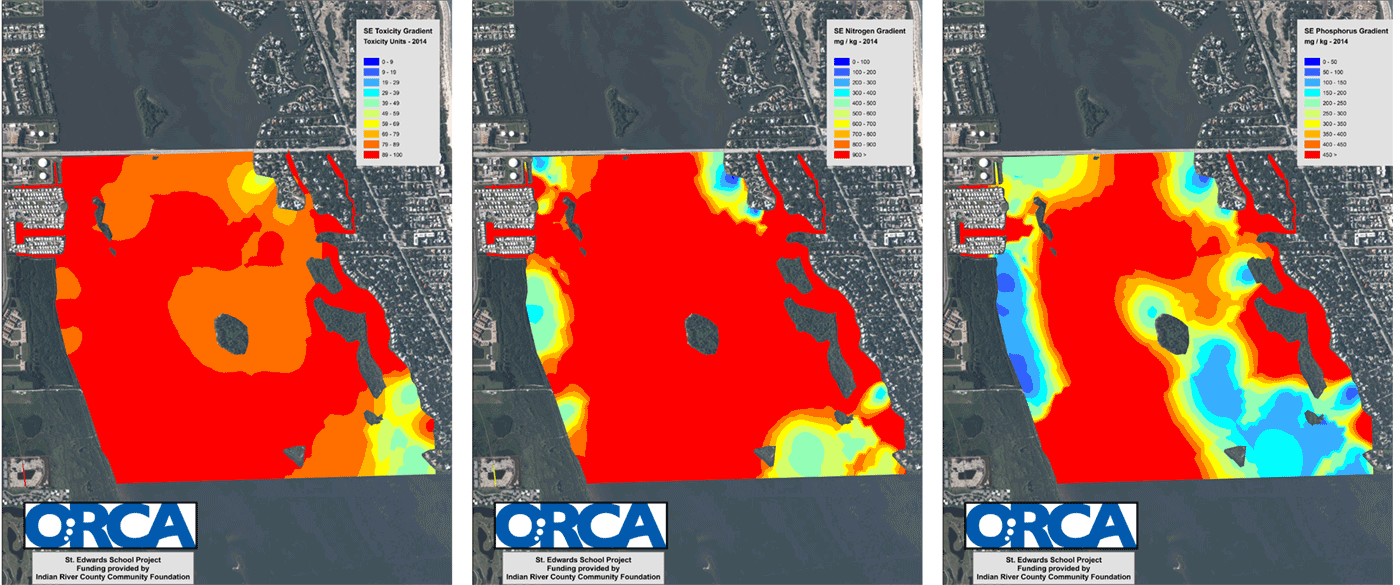
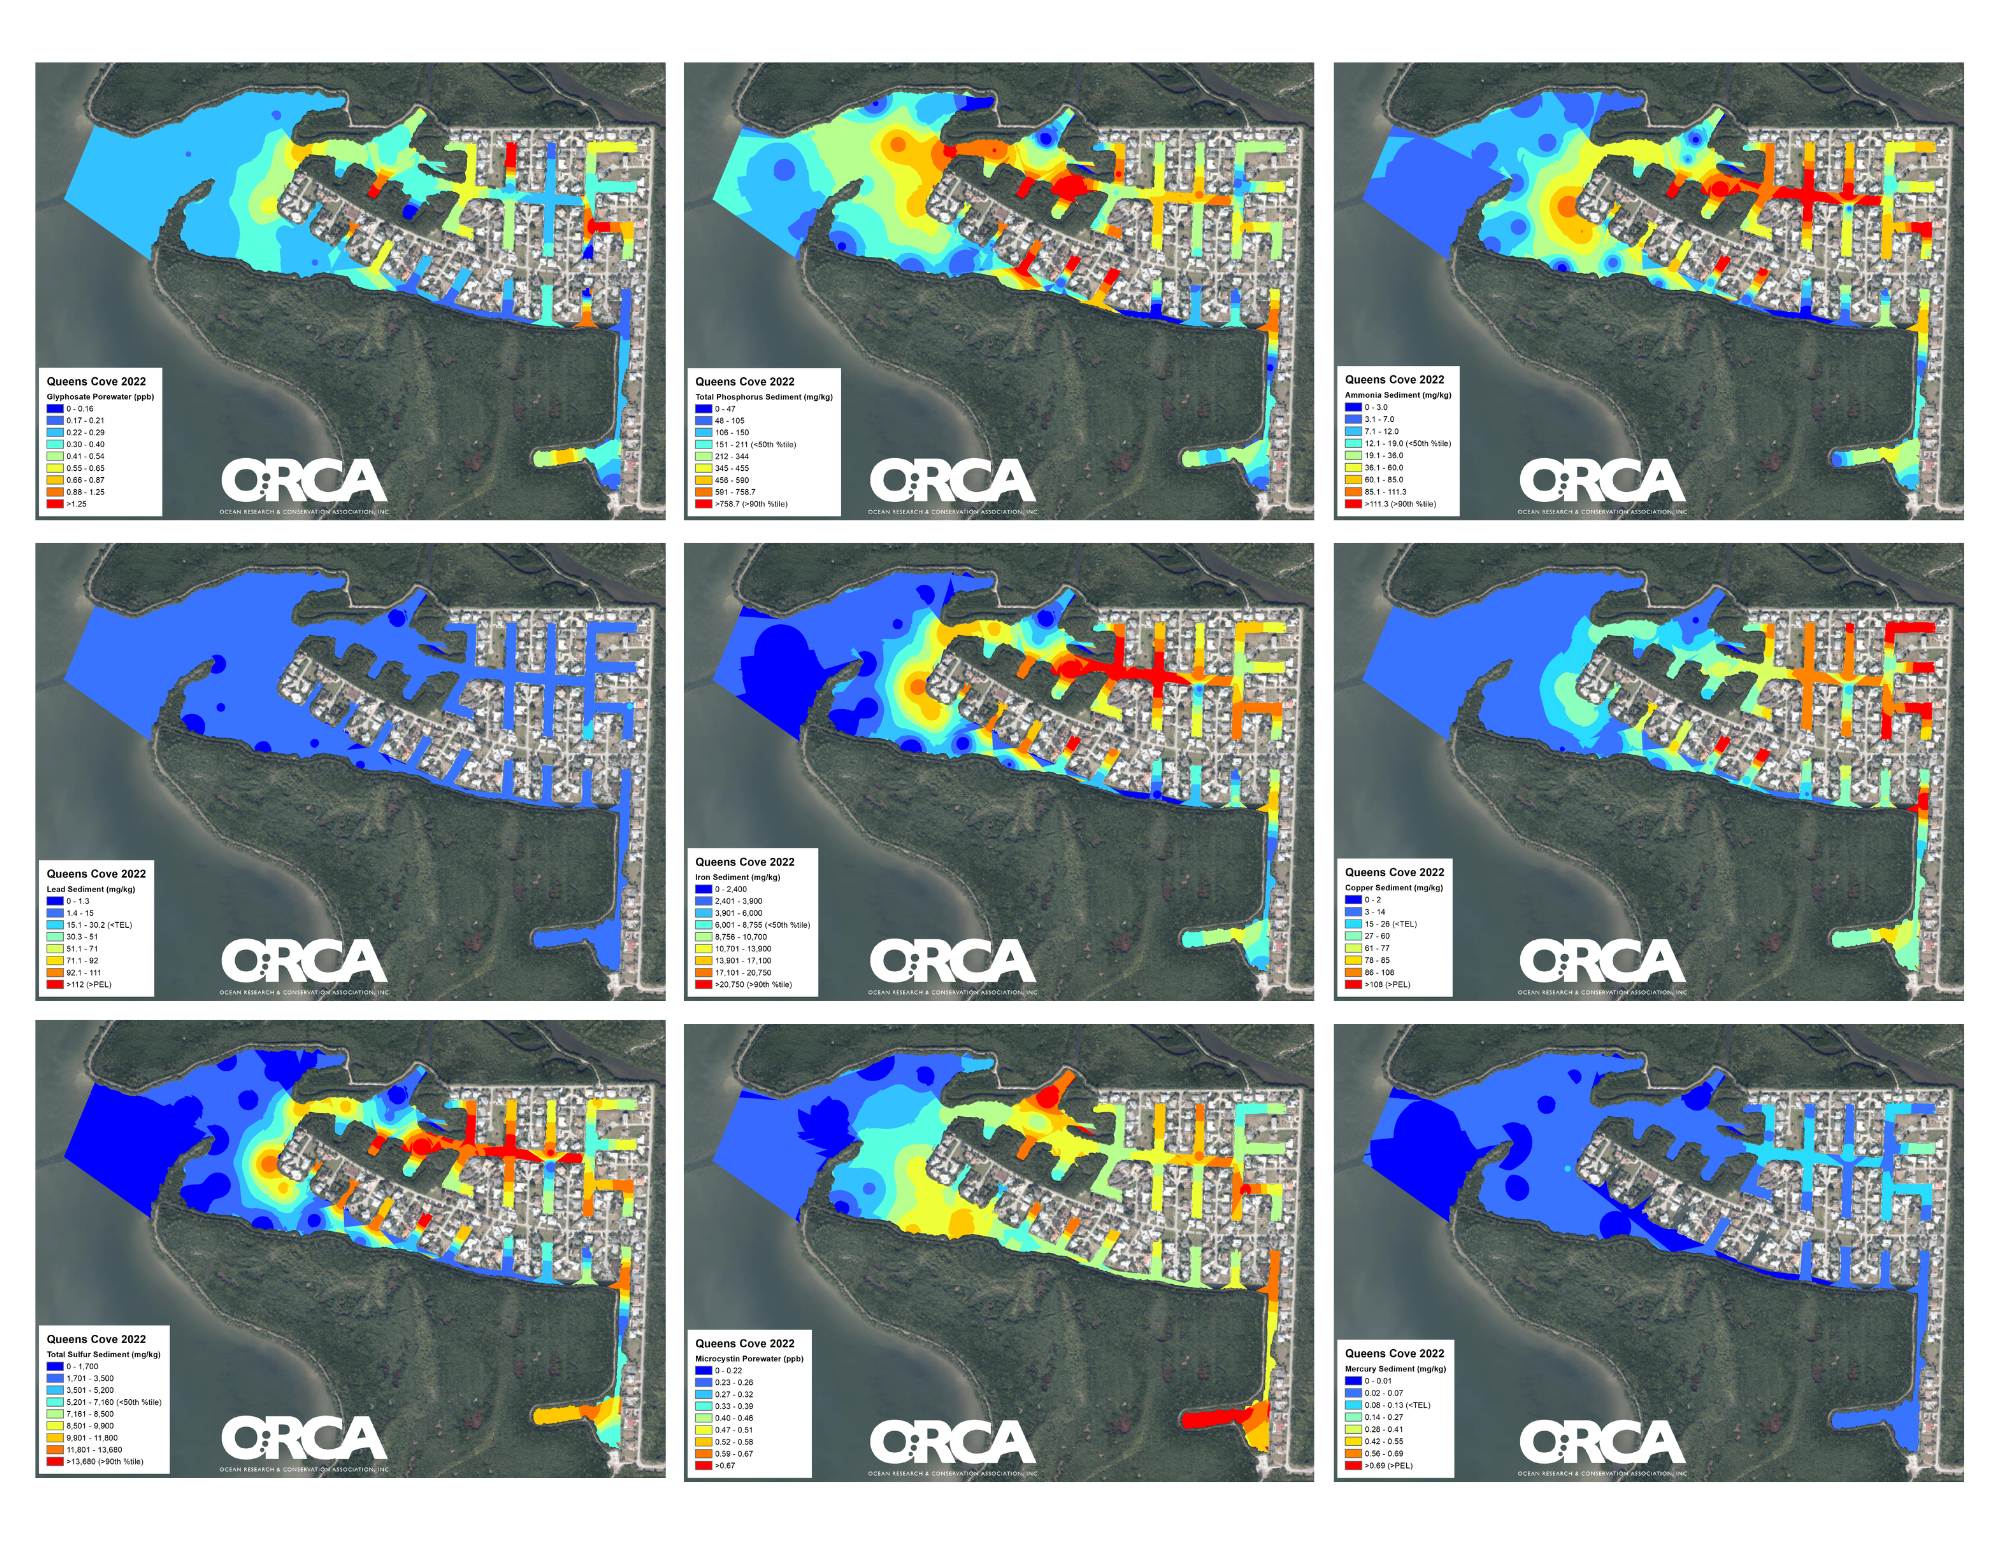
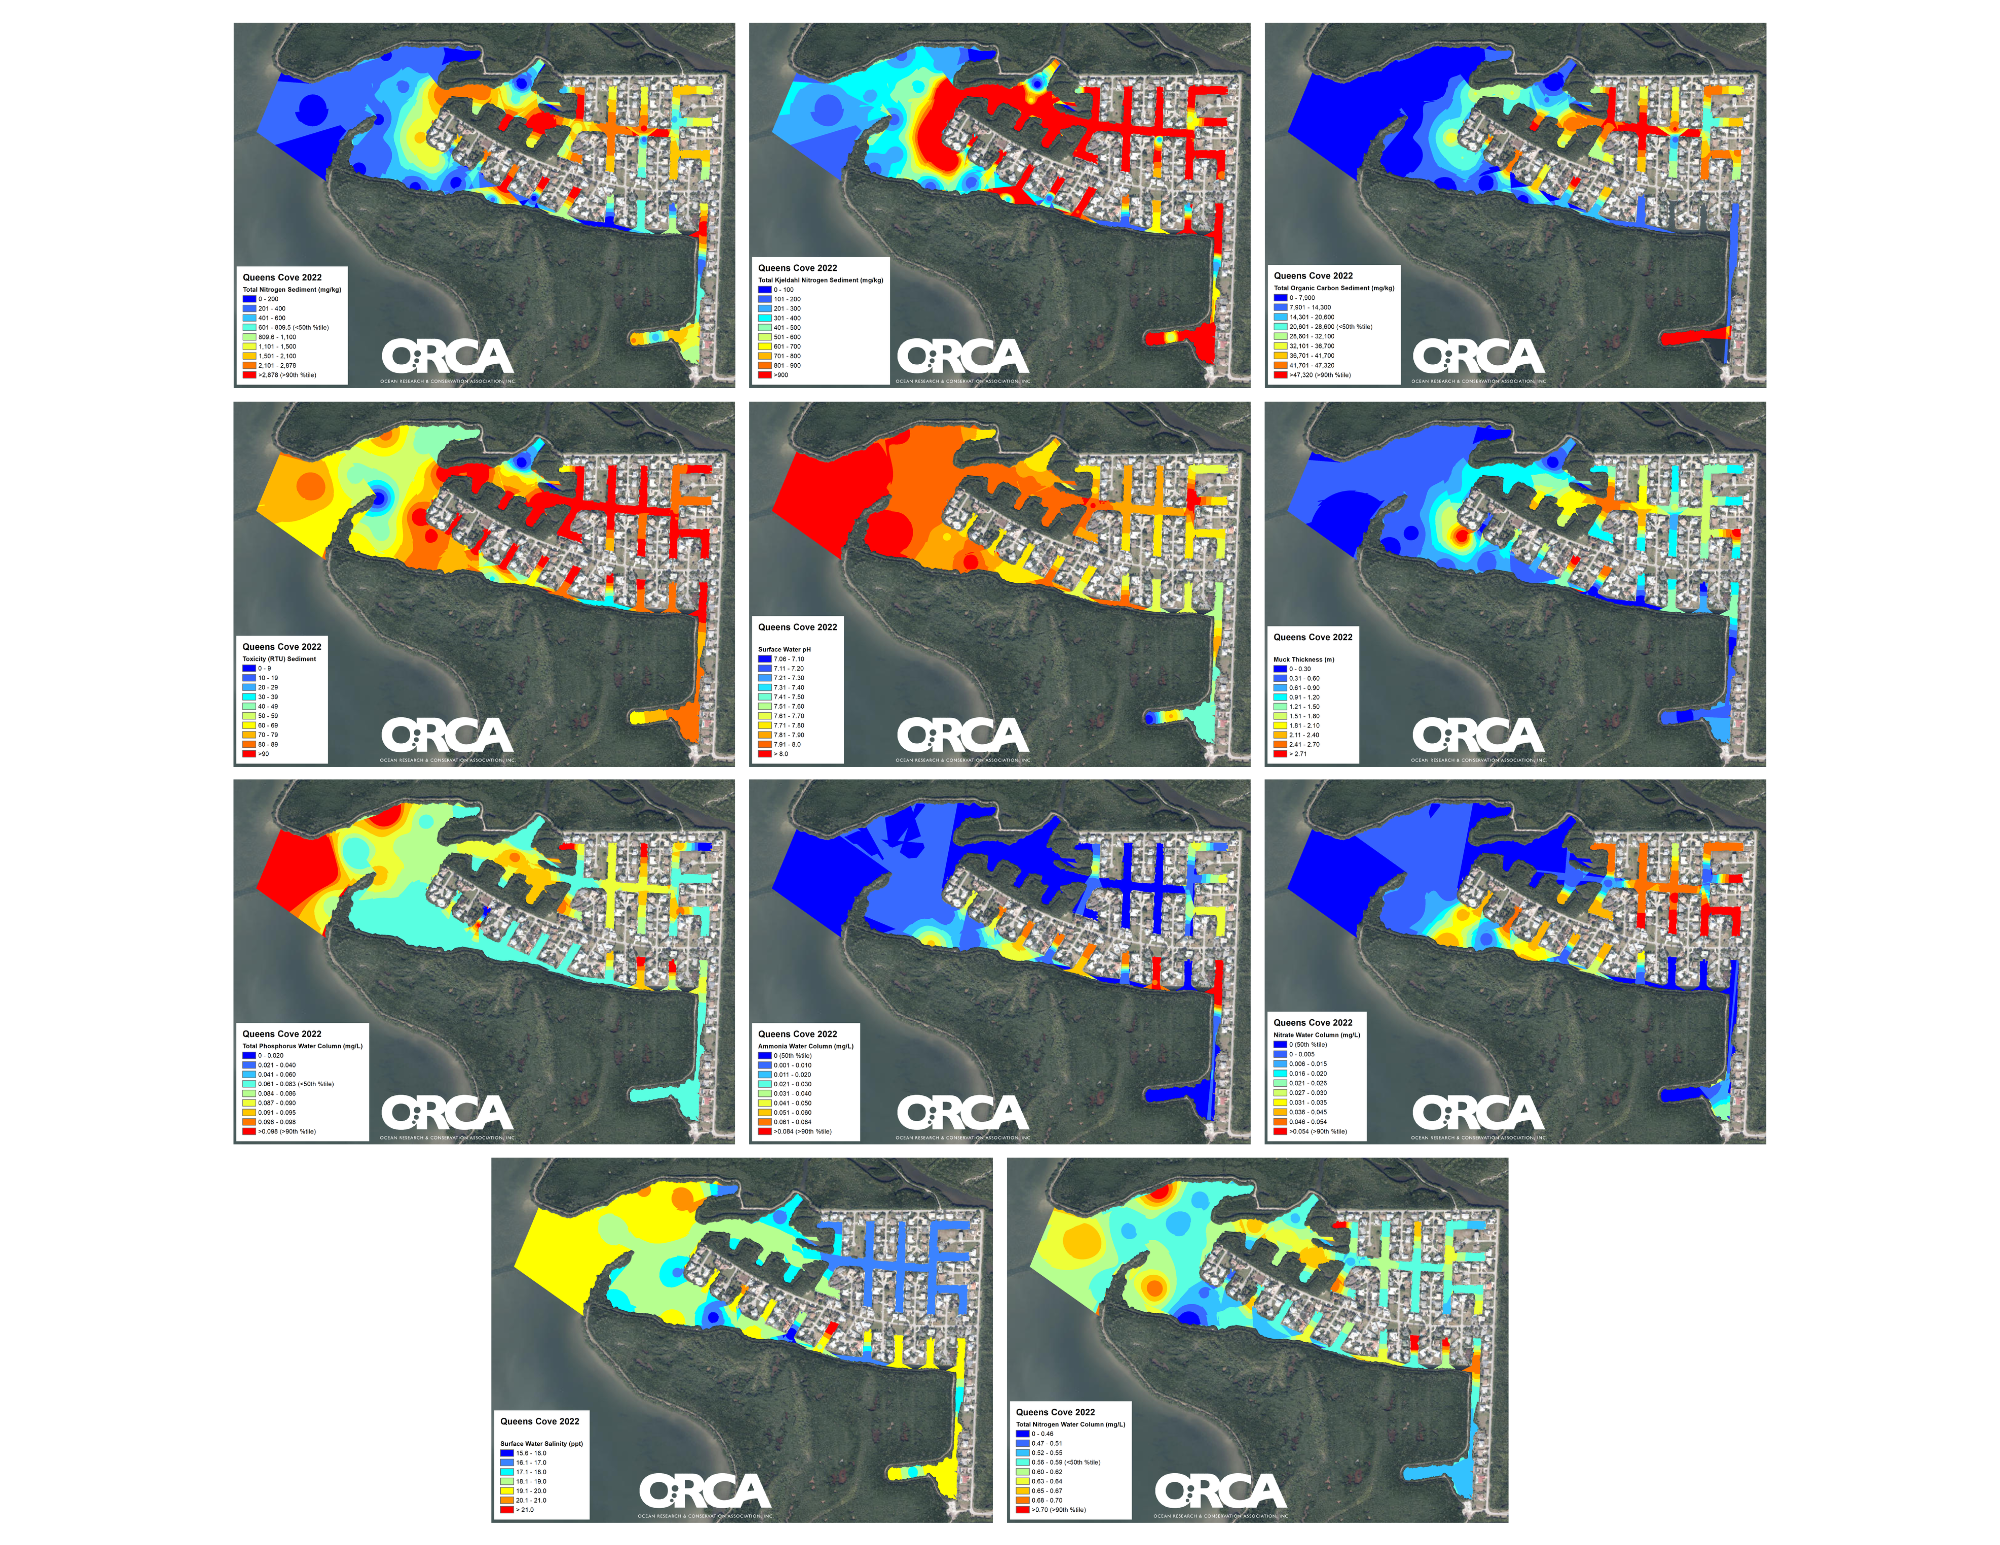
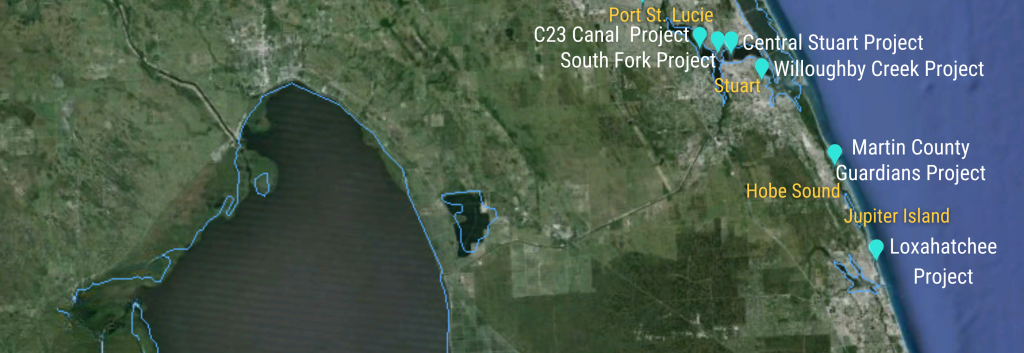
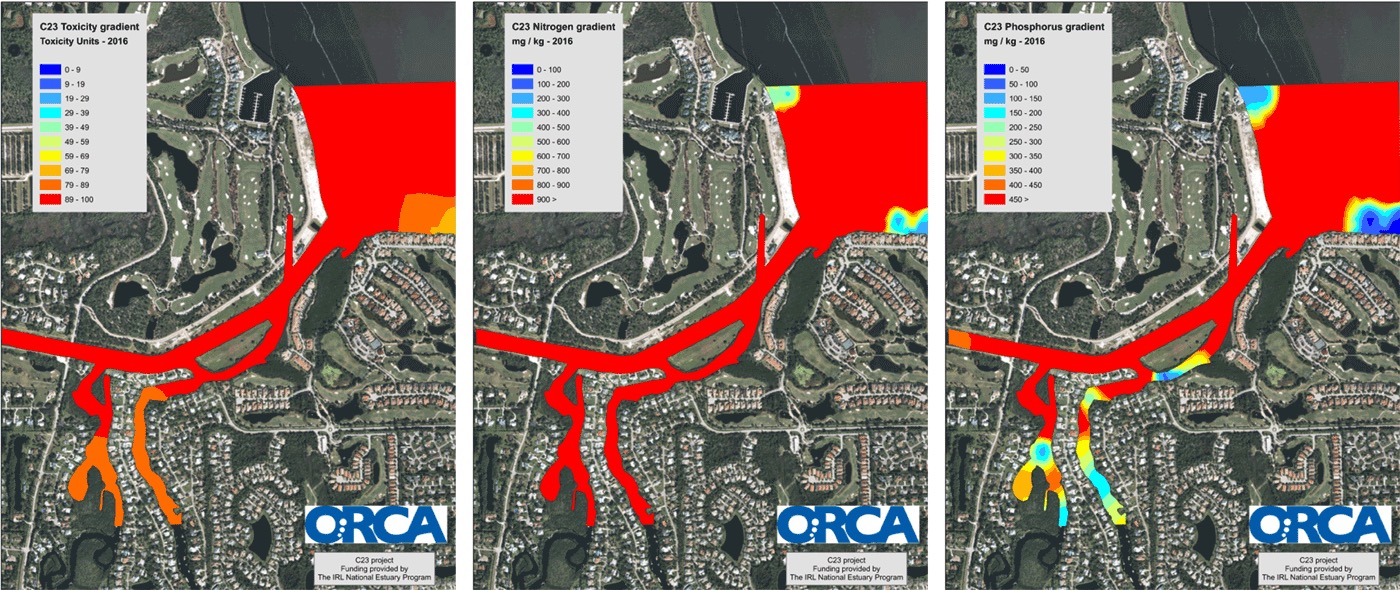
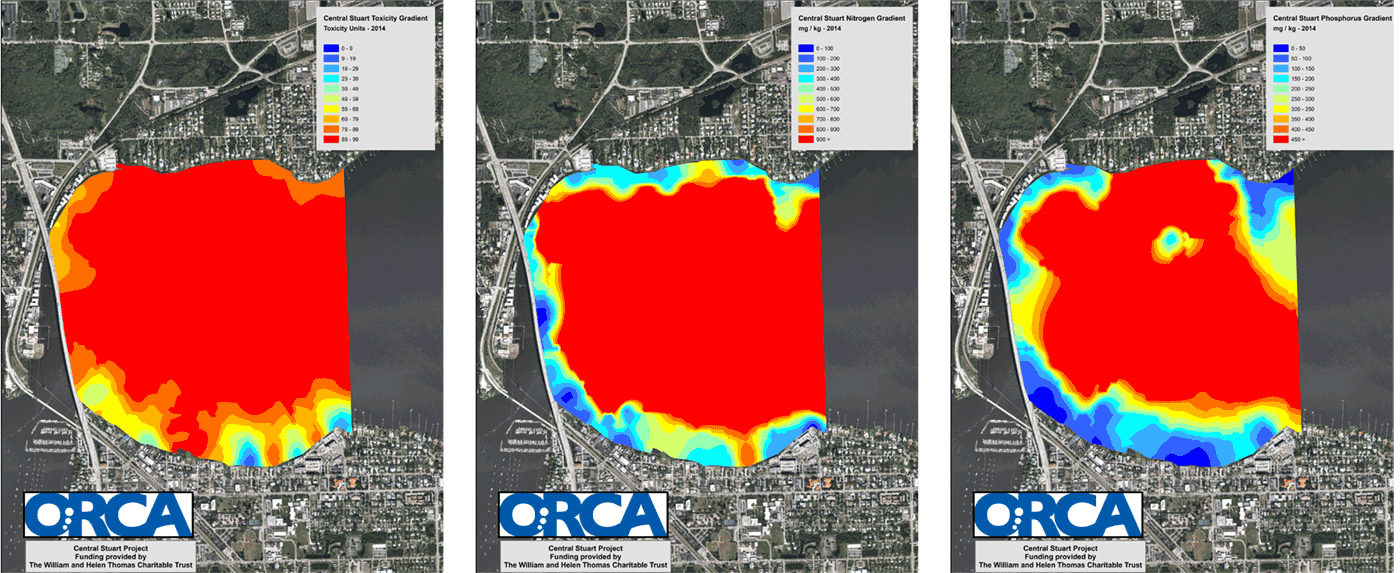
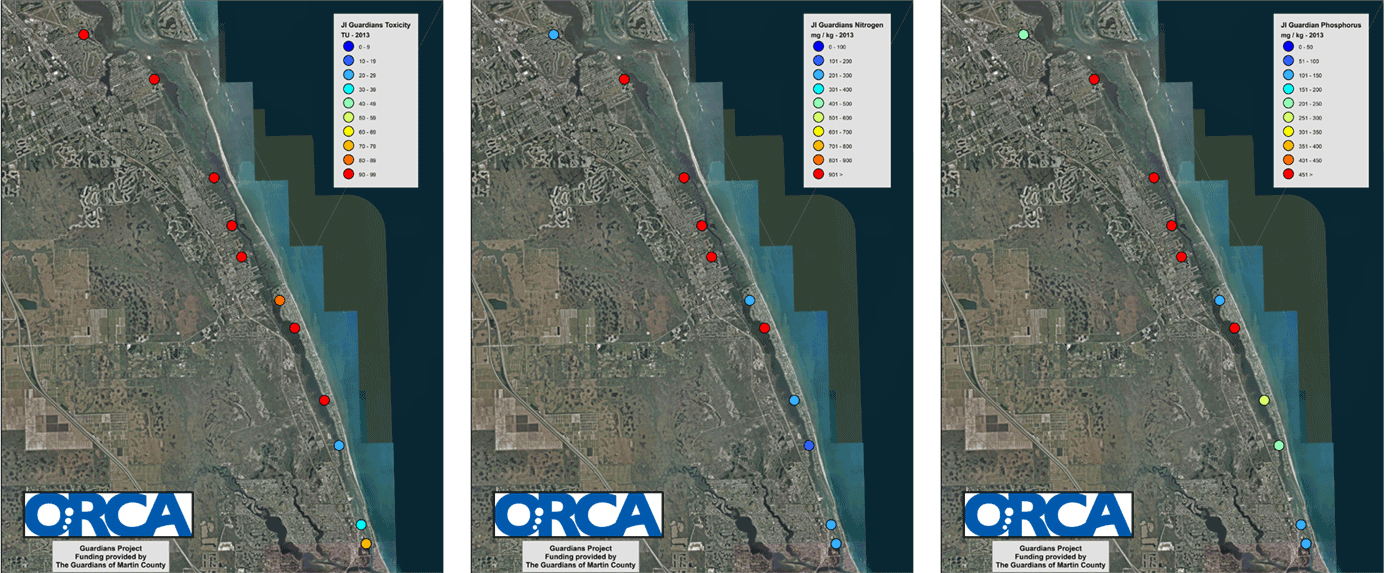
Through our ecotoxicity research, ORCA creates pollution gradient maps that pinpoint contamination hotspots and show where pollution accumulates in the Indian River Lagoon. These visual insights ensure that solutions are targeted where they will make the greatest impact.
Making Pollution Visible
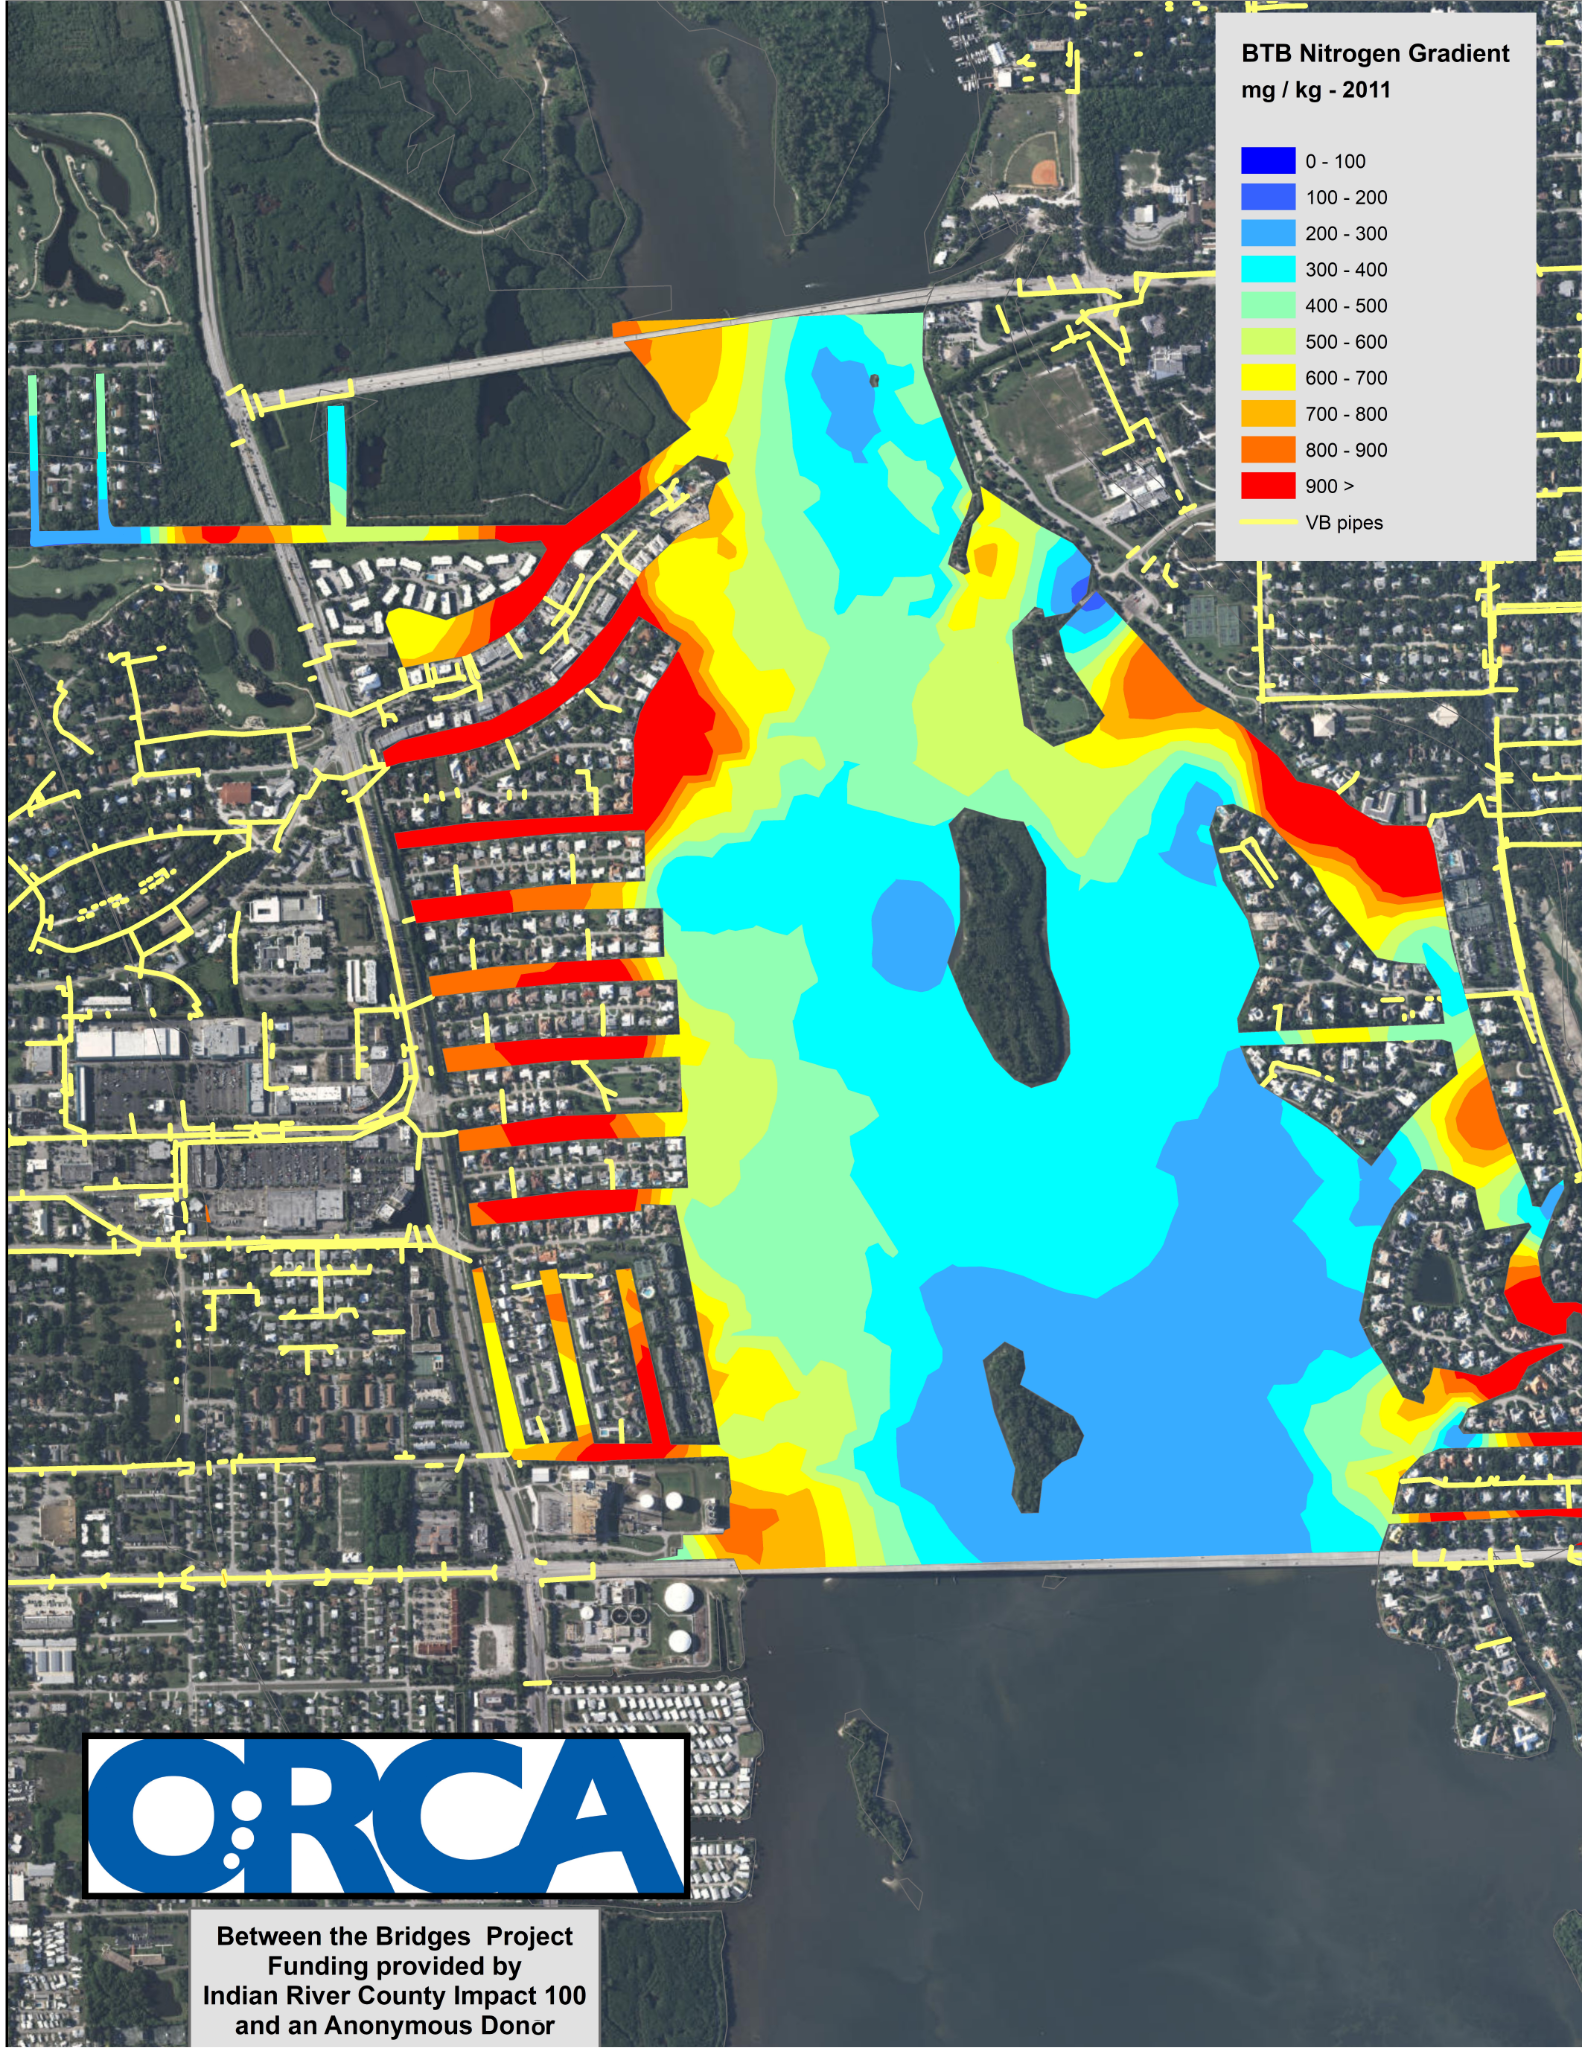
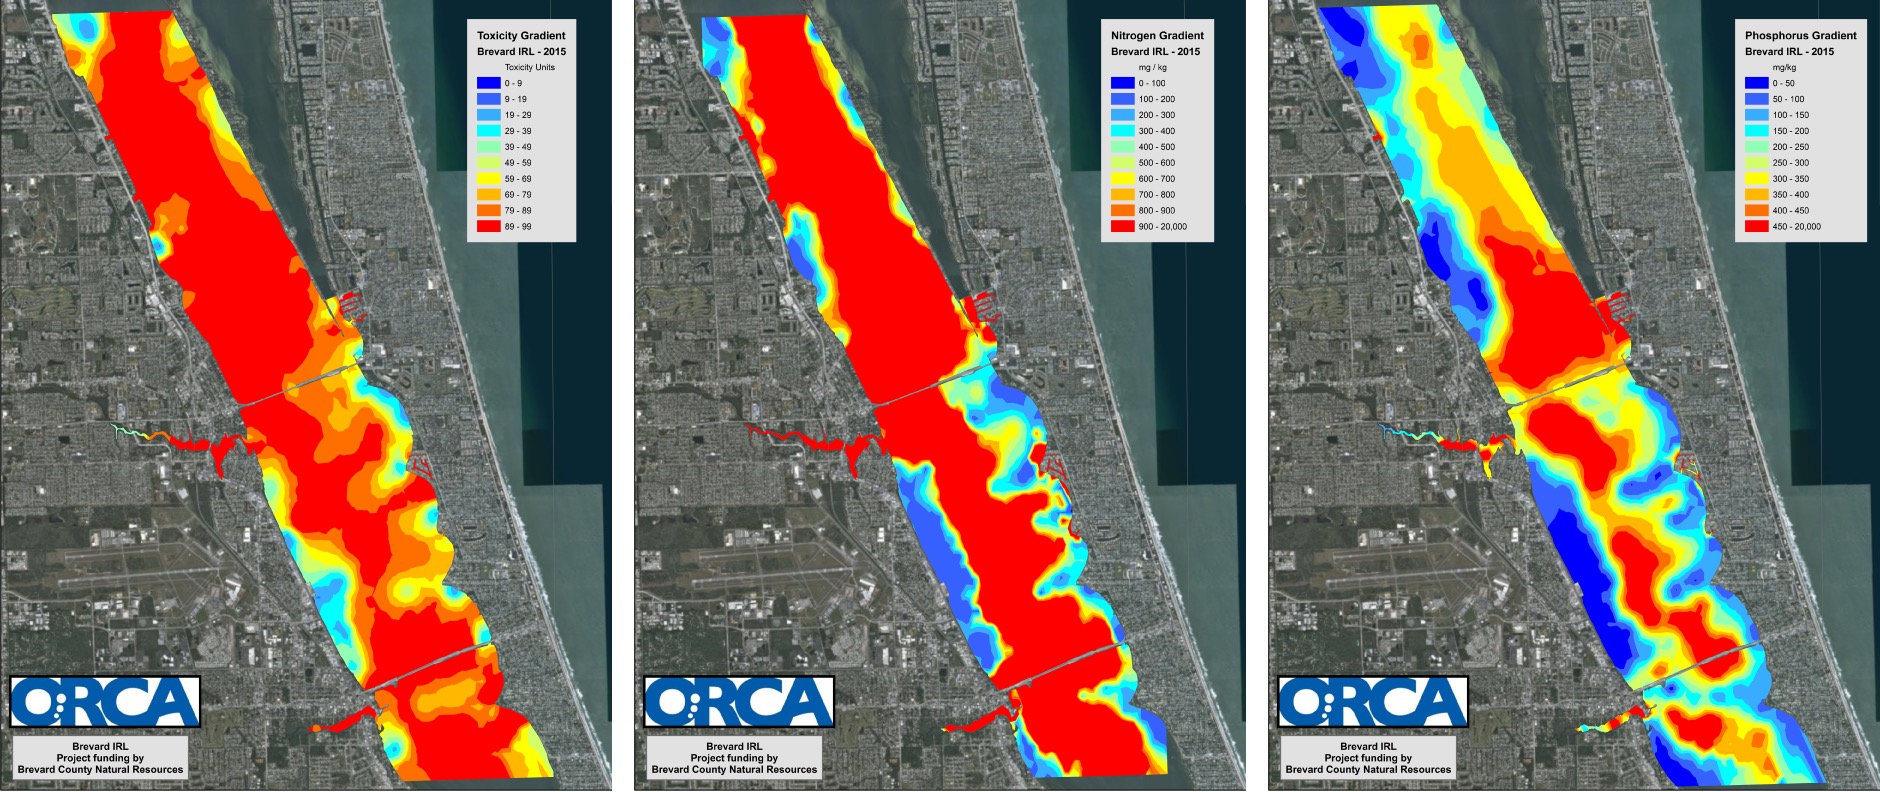
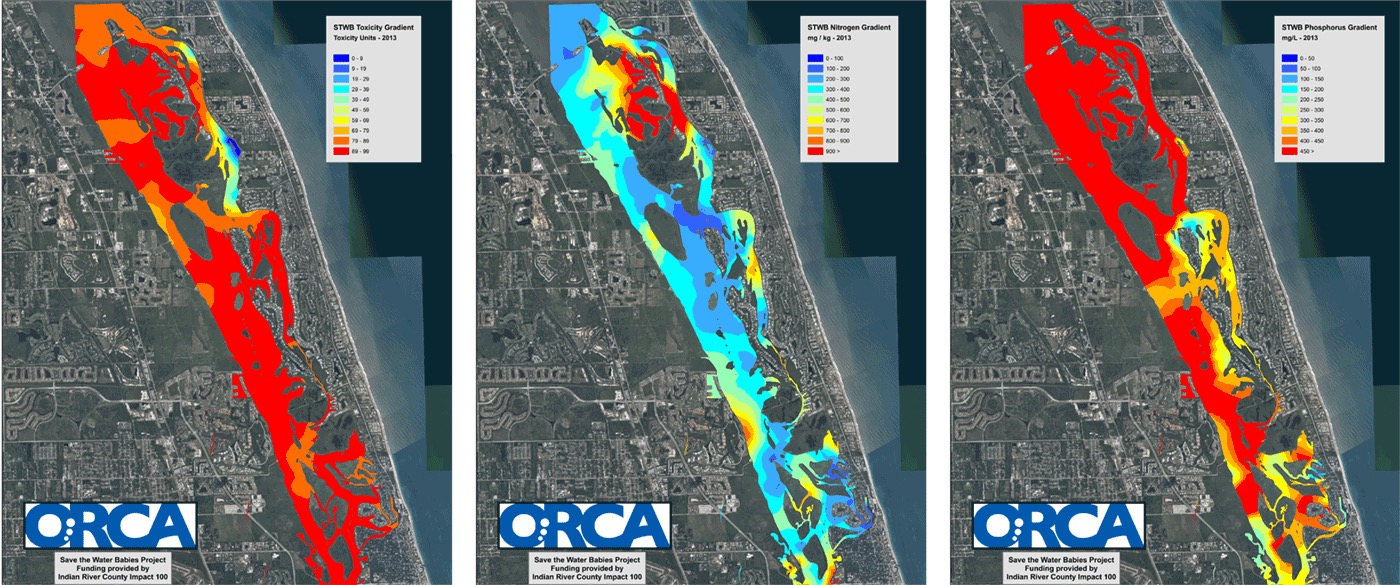
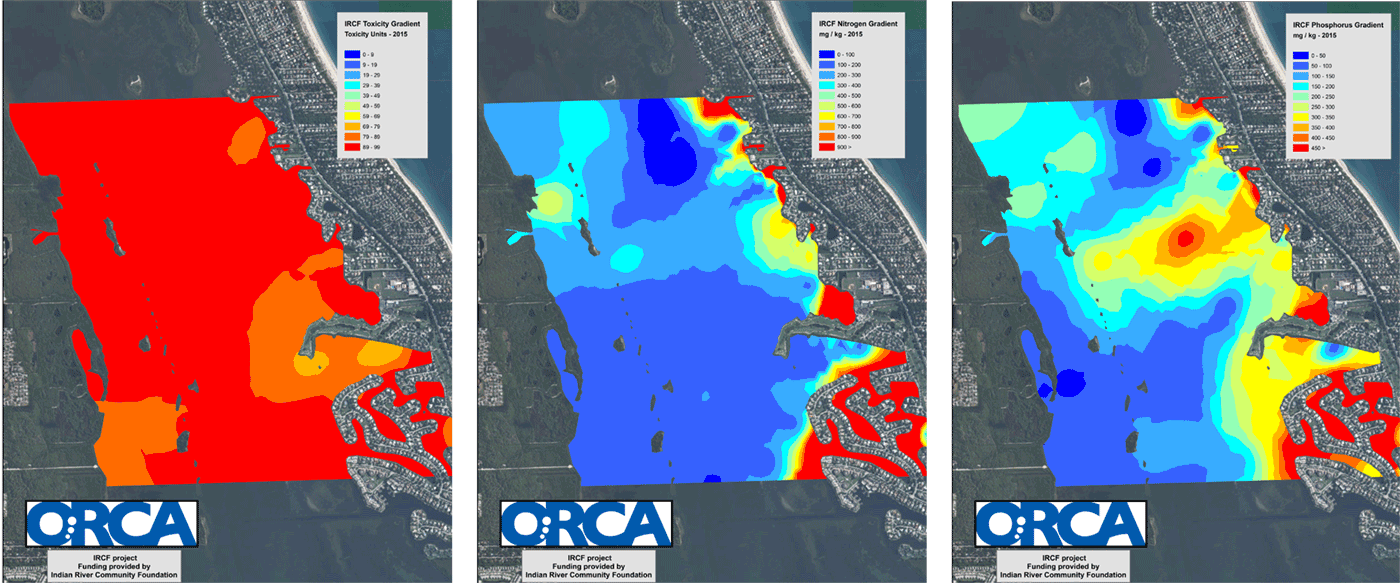
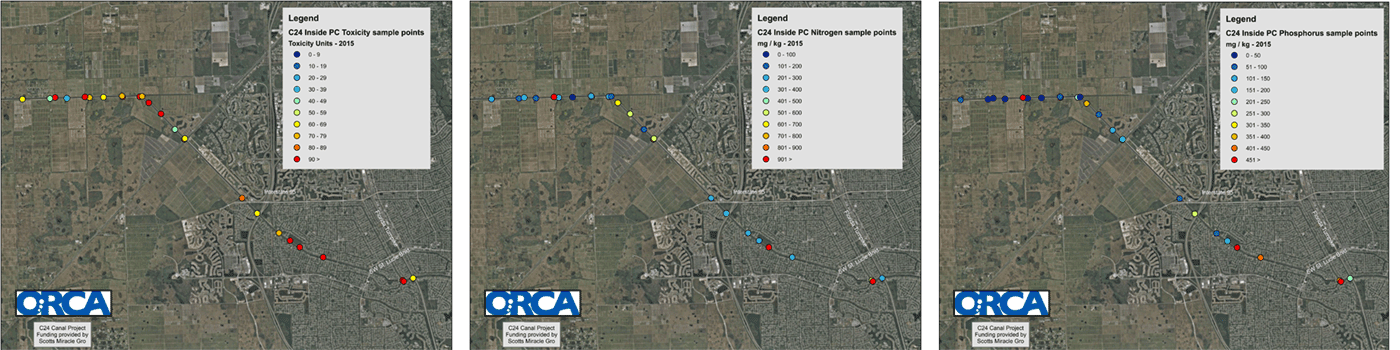
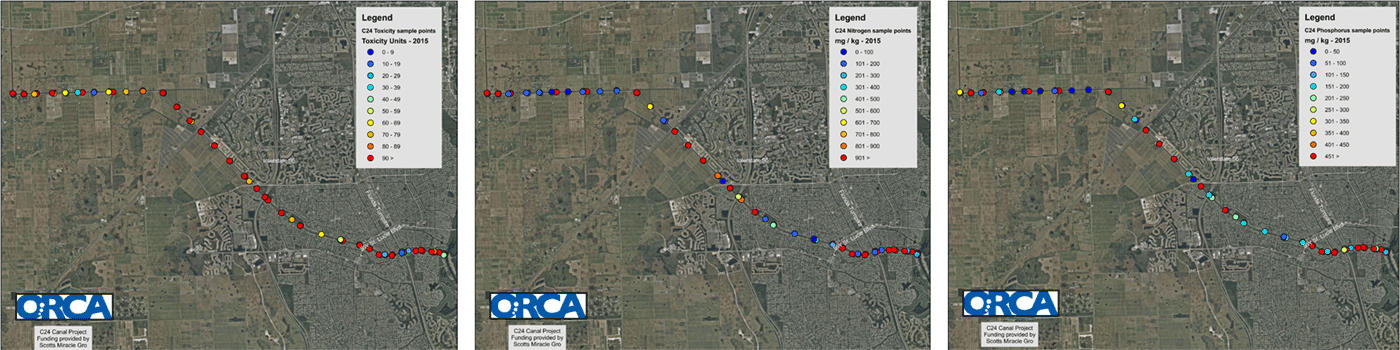
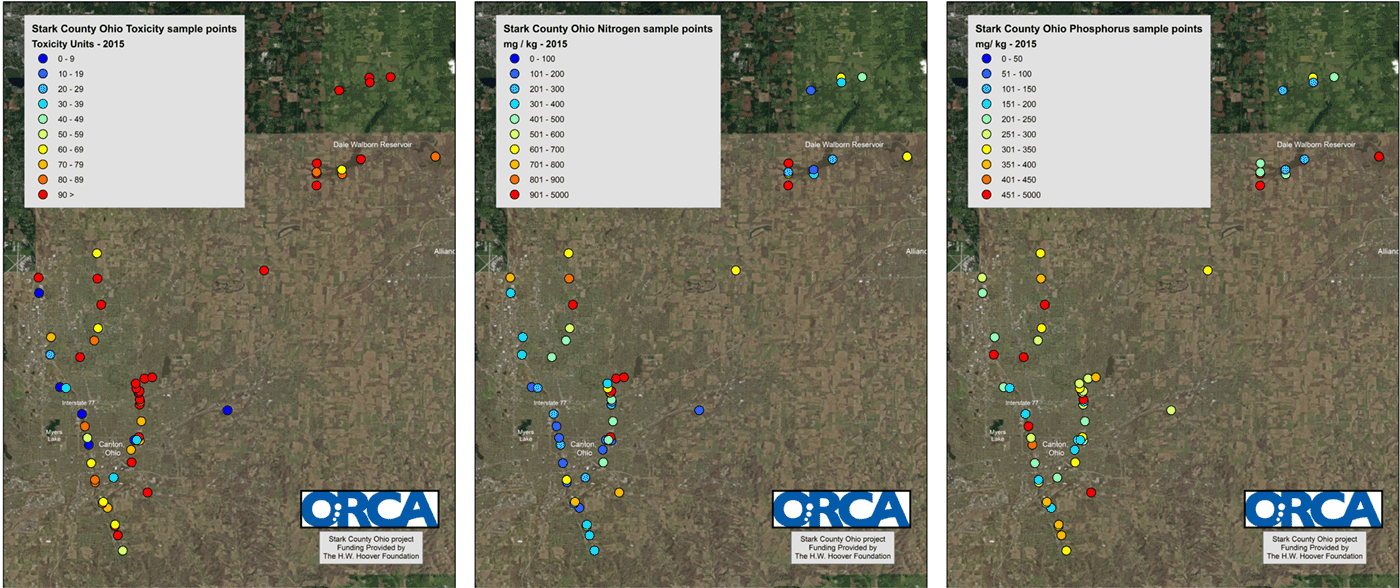
ORCA’s vision is that if pollution can be made visible we can see where it is entering our water ways and how it is accumulating in our ecosystems and work together to stop it at its source. We can also see which measures are working and which aren’t. A case in point is the map here that resulted from our Map-A-Mile Project. It shows total nitrogen in parts per million. High nitrogen is shown in red and low nitrogen in blue. The amount of red in this map is disturbing because high nitrogen can lead to algae blooms, reduced transparency and diminished fish populations. The most striking thing about this map is the high nitrogen accumulation in all the finger canals except for those associated with the Vero Beach Country Club, in the upper left hand corner, where they have been using best practices for lawn maintenance. The take home message is that it is possible to have a beautiful green lawn without over-fertilizing the Indian River Lagoon. Learn what you can do.
Stopping Pollutants
On its own this information will identify regions of high toxicity and nutrient accumulations, but will not indicate the source of the pollution. To meet that challenge, ORCA has developed a marine ecosystem monitoring network called the ORCA Kilroy, which uses state-of-the-art sensors to continuously measure an array of water quality parameters- speed, direction, temperature, salinity, depth, turbidity and prevalence of key micro-organisms- streaming that data via cellular signals and web-based interfaces twenty-four hours per day. Kilroy uses 21st century technology to provide instantaneous data, enabling conservation and enforcement managers with the critical information they need to achieve their mission of healthy coastal environments.
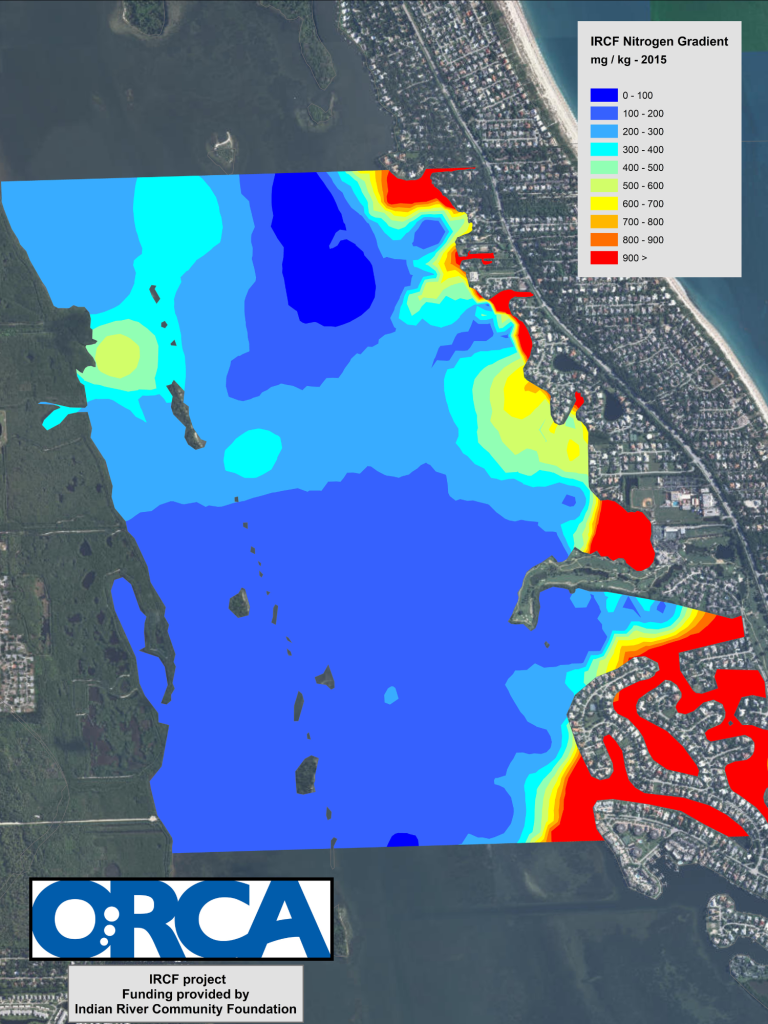
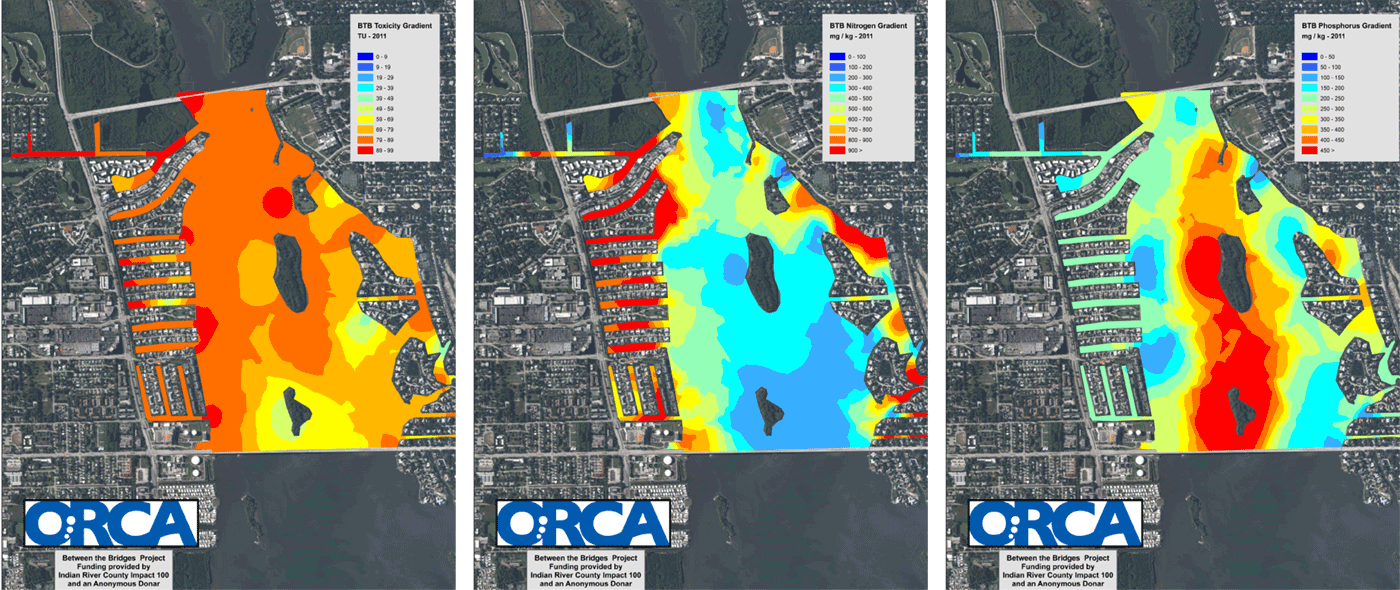
The Ecotoxicity program data allows researchers to begin analyzing the potential causes of pollution, for example the mapped data above shows, interestingly, the samples collected around the Moorings Golf Course had the lowest relative toxicity and nutrients compared to all other samples along the eastern boundary. This may be due in part to the fact that the course has been a certified member of The Audubon Cooperative Sanctuary Program (ACSP) for Golf Courses since February 2014 and the shoreline is comprised of mangroves instead of the bulkheads that are common to so much of that shoreline.